I’m going to look at some launch angle data using the data scraped from Baseball Savant.
library(magrittr)
library(ggplot2)
## Registered S3 methods overwritten by 'ggplot2':
## method from
## [.quosures rlang
## c.quosures rlang
## print.quosures rlanglibrary(dplyr)##
## Attaching package: 'dplyr'## The following objects are masked from 'package:stats':
##
## filter, lag## The following objects are masked from 'package:base':
##
## intersect, setdiff, setequal, unionLoad the data as d
d <- readRDS("MLB2018.rds")d %>% colnames()## [1] "pitch_type" "game_date"
## [3] "release_speed" "release_pos_x"
## [5] "release_pos_z" "player_name"
## [7] "batter" "pitcher"
## [9] "events" "description"
## [11] "spin_dir" "spin_rate_deprecated"
## [13] "break_angle_deprecated" "break_length_deprecated"
## [15] "zone" "des"
## [17] "game_type" "stand"
## [19] "p_throws" "home_team"
## [21] "away_team" "type"
## [23] "hit_location" "bb_type"
## [25] "balls" "strikes"
## [27] "game_year" "pfx_x"
## [29] "pfx_z" "plate_x"
## [31] "plate_z" "on_3b"
## [33] "on_2b" "on_1b"
## [35] "outs_when_up" "inning"
## [37] "inning_topbot" "hc_x"
## [39] "hc_y" "tfs_deprecated"
## [41] "tfs_zulu_deprecated" "fielder_2"
## [43] "umpire" "sv_id"
## [45] "vx0" "vy0"
## [47] "vz0" "ax"
## [49] "ay" "az"
## [51] "sz_top" "sz_bot"
## [53] "hit_distance_sc" "launch_speed"
## [55] "launch_angle" "effective_speed"
## [57] "release_spin_rate" "release_extension"
## [59] "game_pk" "pitcher.1"
## [61] "fielder_3" "fielder_4"
## [63] "fielder_5" "fielder_6"
## [65] "fielder_7" "fielder_8"
## [67] "fielder_9" "release_pos_y"
## [69] "estimated_ba_using_speedangle" "estimated_woba_using_speedangle"
## [71] "woba_value" "woba_denom"
## [73] "babip_value" "iso_value"
## [75] "launch_speed_angle" "at_bat_number"
## [77] "pitch_number" "pitch_name"
## [79] "home_score" "away_score"
## [81] "bat_score" "fld_score"
## [83] "post_away_score" "post_home_score"
## [85] "post_bat_score" "post_fld_score"
## [87] "if_fielding_alignment" "of_fielding_alignment"
## [89] "barrel"It’s not clear what launch_speed_angle is.
d$launch_speed_angle %>% summary## Min. 1st Qu. Median Mean 3rd Qu. Max. NA's
## 1.0 2.0 3.0 3.1 4.0 6.0 594914launch_speed and launch_angle are as expected.
They both have a lot of missing values.
Most of these are pitches not hit.
d$launch_speed %>% summary## Min. 1st Qu. Median Mean 3rd Qu. Max. NA's
## 9.0 73.0 82.9 83.0 94.8 121.7 516581d$launch_angle %>% summary## Min. 1st Qu. Median Mean 3rd Qu. Max. NA's
## -89 -5 17 16 36 90 516579Speed and angle are usually both false or true, which is good.
table(is.na(d$launch_speed), is.na(d$launch_angle))##
## FALSE TRUE
## FALSE 204609 0
## TRUE 2 516579We’ll filter to keep only pitches with launch angle and speed.
dl <- d %>% filter(!is.na(launch_angle), !is.na(launch_speed))We’re going to look at at bat outcomes, shown in events.
dl$events %>% table## .
## batter_interference catcher_interf
## 1 22
## caught_stealing_2b caught_stealing_home
## 1 1
## double double_play
## 8264 458
## field_error field_out
## 1575 73675
## fielders_choice fielders_choice_out
## 94 331
## force_out grounded_into_double_play
## 3614 3457
## hit_by_pitch home_run
## 389 5585
## null other_out
## 77742 2
## pickoff_1b pickoff_2b
## 4 2
## pickoff_caught_stealing_2b pickoff_caught_stealing_3b
## 14 1
## run sac_bunt
## 1 822
## sac_bunt_double_play sac_fly
## 1 1225
## sac_fly_double_play single
## 10 26316
## strikeout triple
## 130 847
## triple_play walk
## 2 23des is useless and too specific.
dl$des %>% head## [1] "Marcus Semien singles on a line drive to right fielder Kole Calhoun. Boog Powell scores. Matt Joyce to 2nd. "
## [2] "null"
## [3] "null"
## [4] "Boog Powell triples (1) on a line drive to left fielder Justin Upton. "
## [5] "null"
## [6] "Jonathan Lucroy pops out to first baseman Jefry Marte in foul territory. "A lot of the categories have few instances.
But we can see a clear pattern in home_run and extra base hits
compared to outs.
ggplot(dl) + geom_point(aes(launch_speed, launch_angle)) + facet_wrap(. ~ events)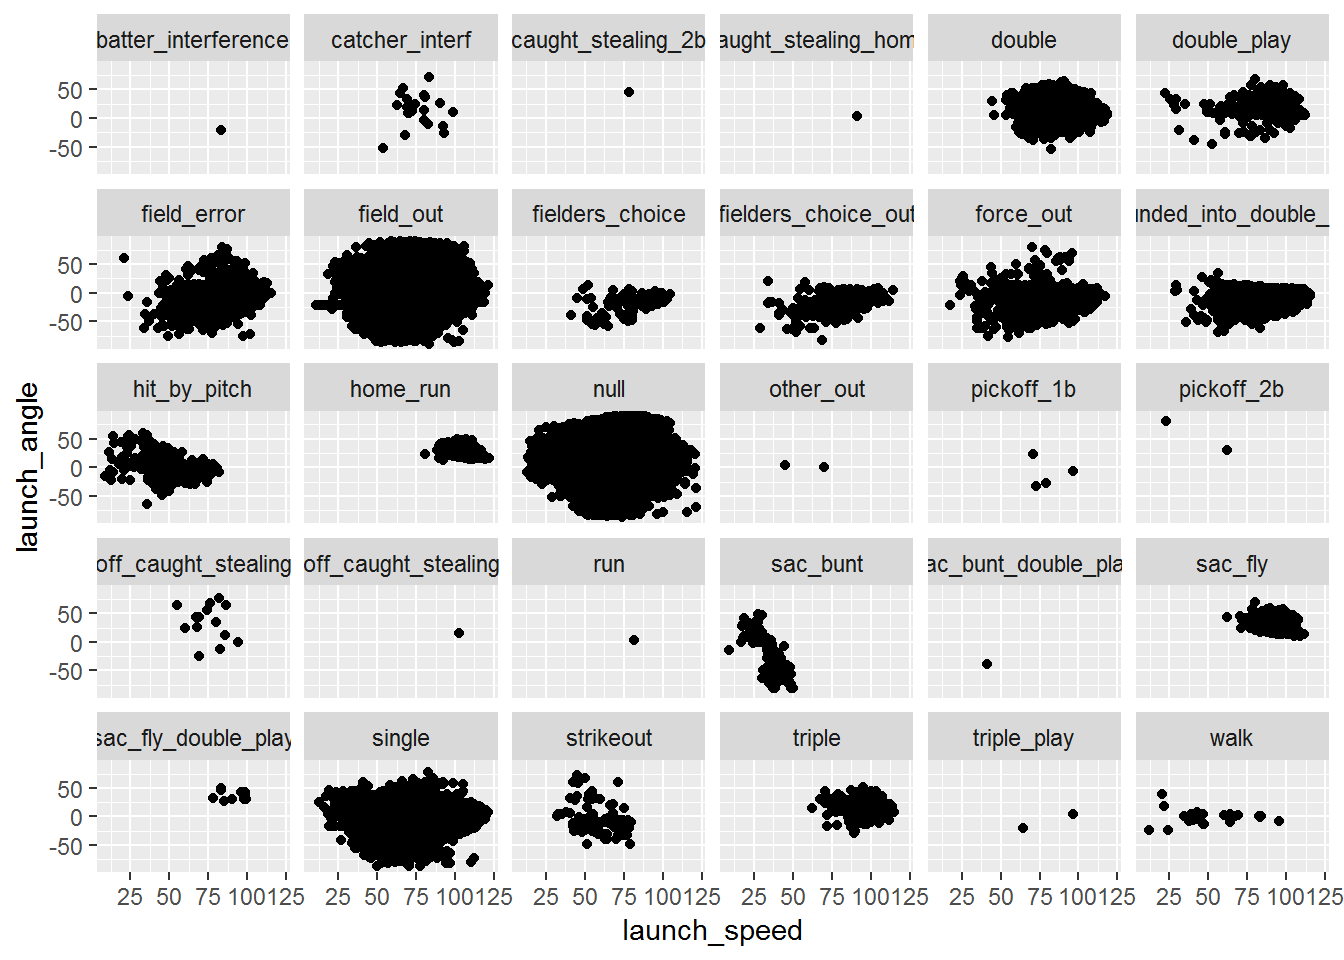
Estimated woba might be useful.
dl$estimated_woba_using_speedangle %>% summary## Min. 1st Qu. Median Mean 3rd Qu. Max. NA's
## 0.00 0.06 0.22 0.36 0.55 2.02 78333dl$estimated_woba_using_speedangle %>% is.na %>% summary## Mode FALSE TRUE
## logical 126276 78333We will keep only events with at least 800 instances.
ggplot(dl %>% group_by(events) %>% mutate(N=n()) %>% ungroup %>% filter(N>800)) +
  geom_point(aes(launch_speed, launch_angle), alpha=.2) + facet_wrap(. ~ events)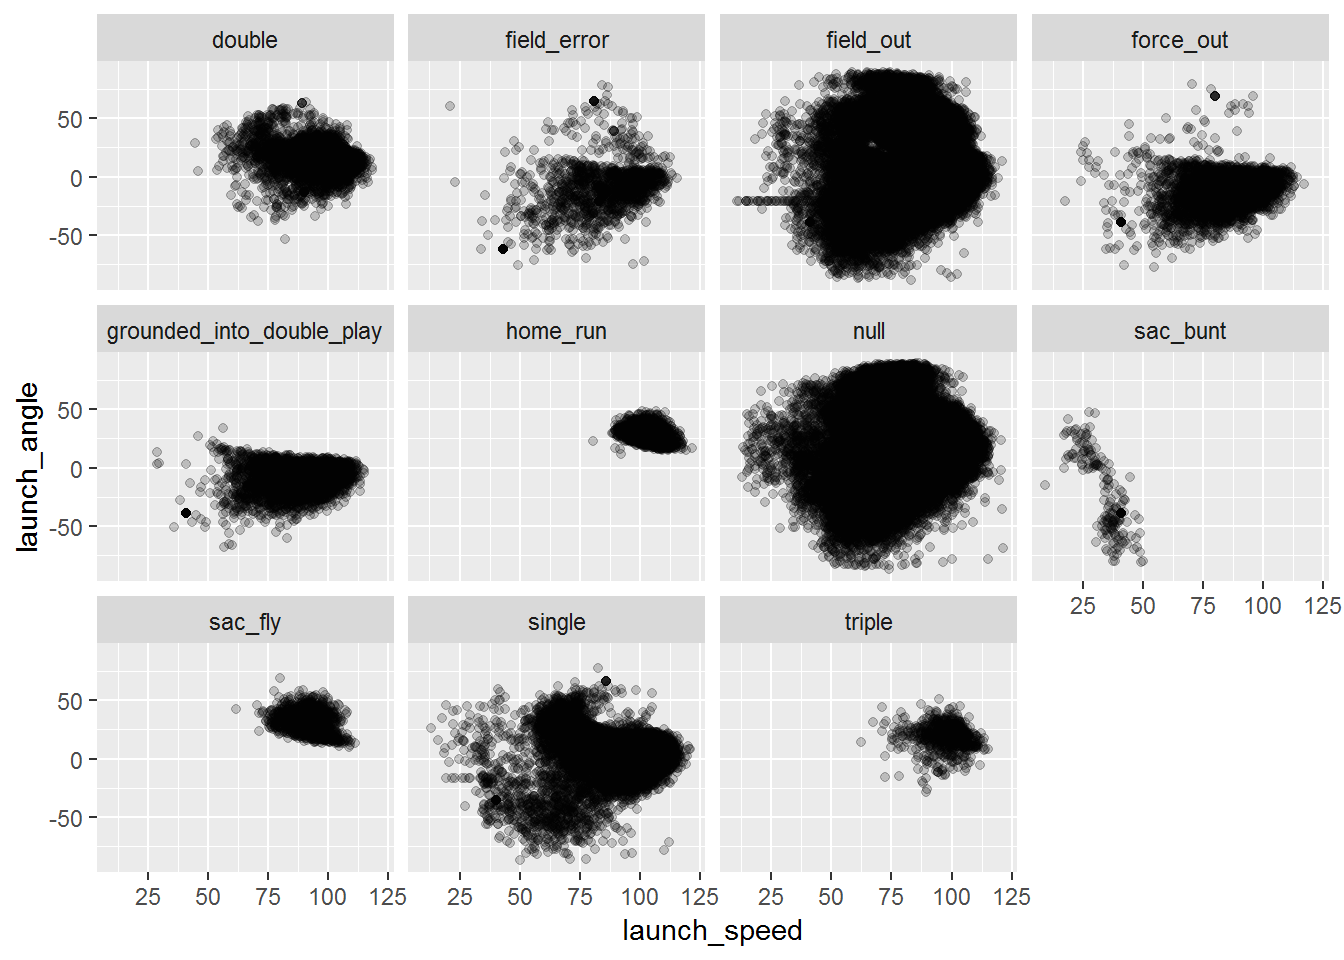
Here’s a plot for the densities of these.
ggplot(dl %>% group_by(events) %>% mutate(N=n()) %>% ungroup %>% filter(N>800)) +
  geom_density2d(aes(launch_speed, launch_angle)) + facet_wrap(. ~ events)
## Warning: Computation failed in `stat_density2d()`:
## bandwidths must be strictly positive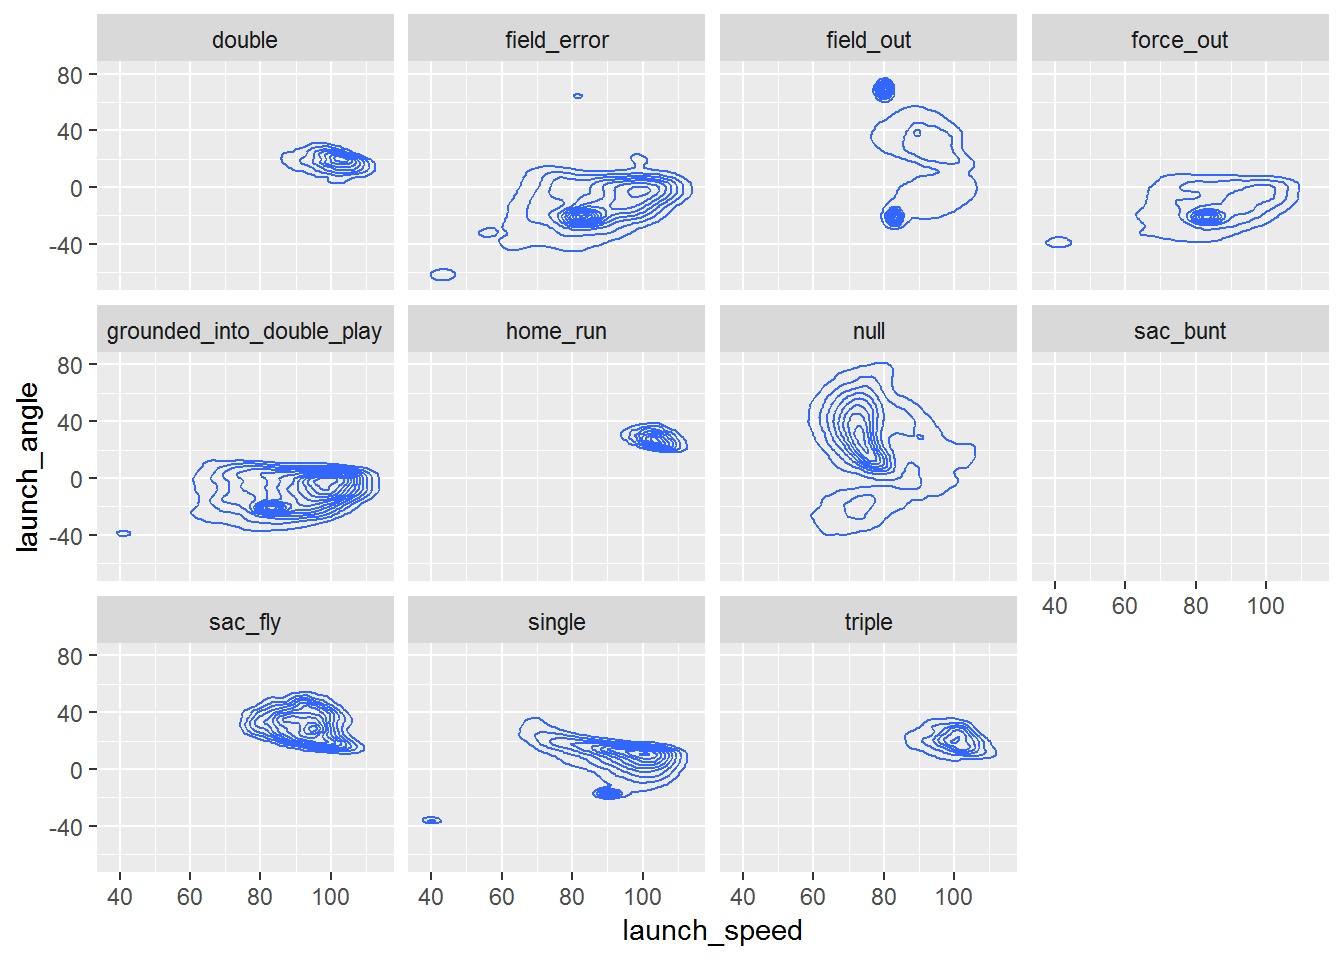
This plot below looks a little better. There’s a clear difference in what leads to extra-base hits compared to outs. It’s not clear what null is. And there’s nothing for a fly out.
ggplot(dl %>% group_by(events) %>% mutate(N=n()) %>% ungroup %>% filter(N>800)) +
  stat_density_2d(aes(launch_speed, launch_angle, fill=..level..), geom="polygon")+
  scale_fill_gradient(low="blue", high="red") + facet_wrap(. ~ events)
## Warning: Computation failed in `stat_density2d()`:
## bandwidths must be strictly positive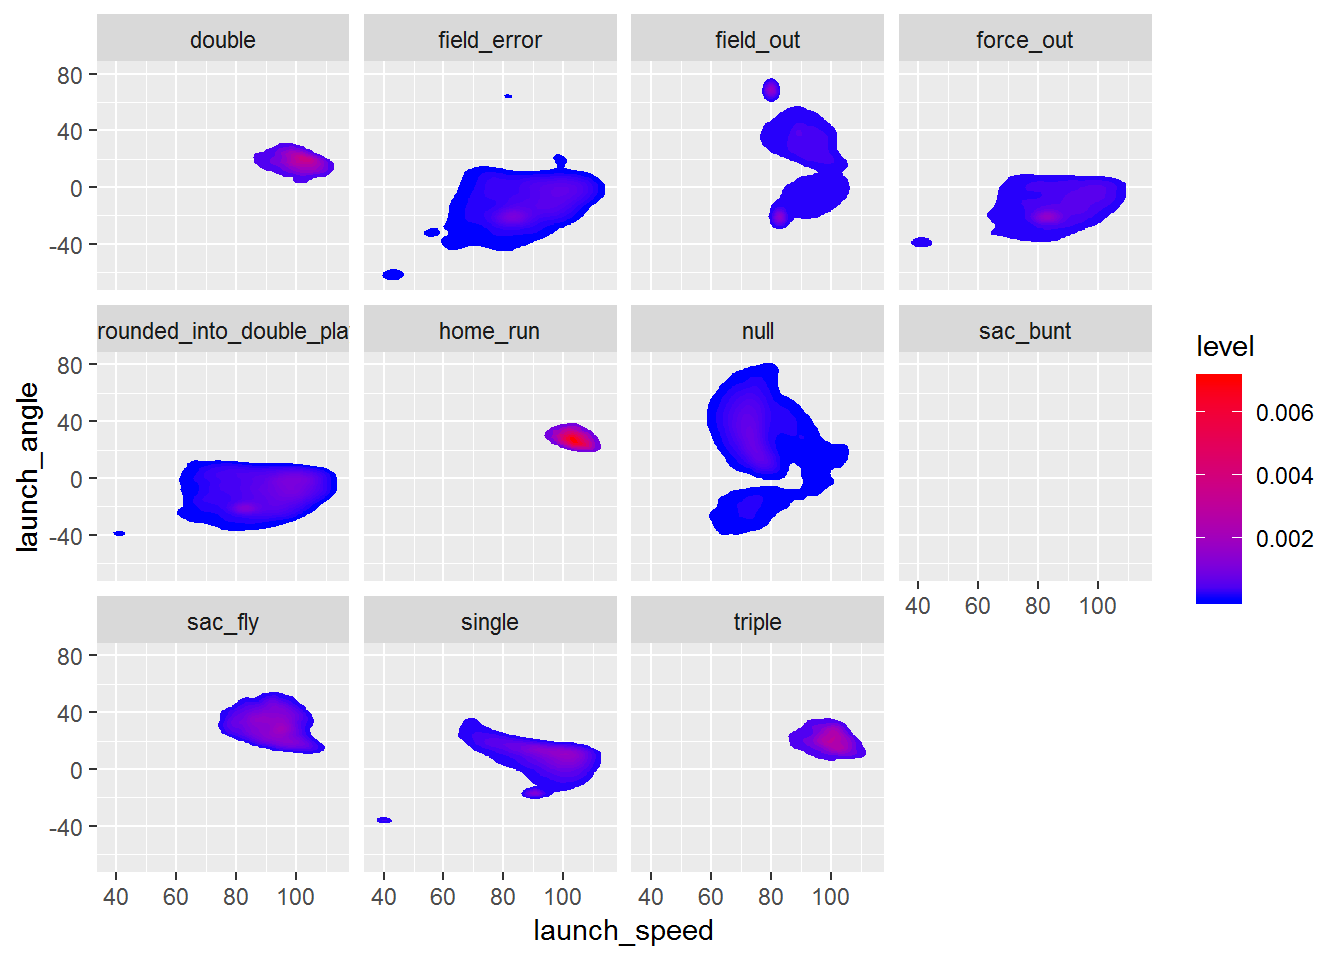
dl %>% group_by(events) %>% mutate(N=n()) %>% ungroup %>% filter(N>800) %>% .$events %>% table## .
## double field_error
## 8264 1575
## field_out force_out
## 73675 3614
## grounded_into_double_play home_run
## 3457 5585
## null sac_bunt
## 77742 822
## sac_fly single
## 1225 26316
## triple
## 847There’s a lot of null events. And they don’t have descriptions either. Could they be foul balls? There were almost 130,000 foul balls in 2017, so 77,742 is a bit too low. But it kind of makes sense from the plot above that there would be fewer foul balls with a launch angle of zero since that would be going through the bat. The number of balls put in play is about right, but null doesn’t match with foul balls. Maybe not all foul balls have recorded launch angle and speeds?
(dl$events=="null") %>% table## .
## FALSE TRUE
## 126867 77742I’m going to need to investigate this more, but it seems like null might be foul balls.