I recently came across the R package ggrough after seeing
this tweet
while checking the #rstats topic on Twitter.
It makes plots that look like they were haphazardly sketched.
I figured I’d give it a try to see if I could get it to work.
You can find it on GitHub here. The package is still in progress and has many problems.
Set up
First you need to install ggrough.
#install.packages("devtools")
devtools::install_github("xvrdm/ggrough")
I also had to install showtext, which I also got from GitHub.
devtools::install_github("yixuan/showtext")Getting data
I’m going to try data other than was included in the
example on the GitHub page (mtcars).
I found the
Ballarat pet dataset
from the
Google Dataset Search.
pets <- read.csv("https://data.gov.au/dataset/c916481b-6a03-45fb-a651-7d294e8fd6b8/resource/96c5a6de-2f89-4cf5-9b90-159e5be97c31/download/ballaratregisteredanimals.csv")str(pets)## 'data.frame': 43581 obs. of 8 variables:
## $ animal_name: Factor w/ 8505 levels "","\"M\"","???",..: 532 4305 4201 2713 8350 8231 7571 6995 4454 3167 ...
## $ age : int 32 29 26 19 18 12 18 15 13 10 ...
## $ colour : Factor w/ 185 levels "","Apricot","Apricot And Black",..: 46 46 5 181 17 86 17 181 46 5 ...
## $ suburb : Factor w/ 58 levels "","Addington",..: 2 2 2 2 2 2 2 2 2 2 ...
## $ postcode : int 3352 3352 3352 3352 3352 3352 3352 3352 3352 3352 ...
## $ breed : Factor w/ 353 levels "Abyssinian","Abyssinian (Cross)",..: 78 136 182 175 130 144 43 131 182 186 ...
## $ type : Factor w/ 2 levels "Cat","Dog": 2 2 2 2 2 2 2 2 2 2 ...
## $ registered : logi FALSE FALSE FALSE FALSE FALSE FALSE ...Using ggrough
Load the libraries
library(ggplot2)
library(ggrough)
library(showtext)
## Loading required package: sysfonts## Loading required package: showtextdbFirst we make the plot with ggplot2. I’m just going to plot a histogram of the age by the type of animal.
# p <- ggplot(data=pets, mapping=aes(x=type)) + geom_bar()
p <- ggplot(data=pets[!is.na(pets$age),], mapping=aes(x=age, fill=type)) + geom_histogram(bins=20) + facet_grid(type ~ .)
p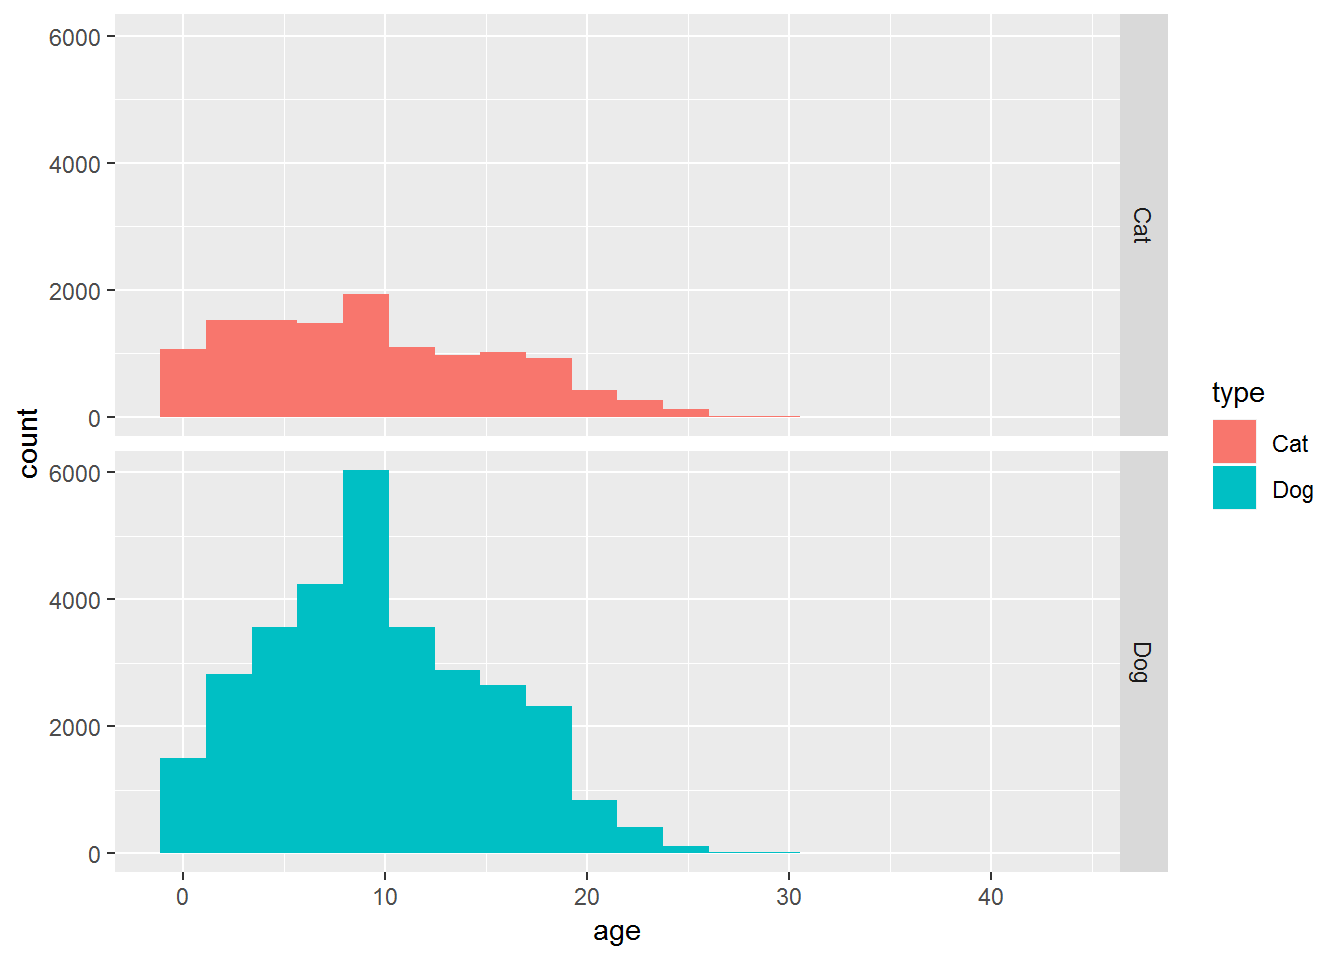
So there’s a simple bar chart. Now we want to make it look rough.
options <- list(
  Background=list(roughness=4),
  GeomCol=list(fill_style="solid", bowing=0, roughness=6))
get_rough_chart(p, options,
                #family = "Homemade Apple",
                font_size_booster = 1.45)
I can’t get the image to show up in RStudio. However, in the RStudio Viewer if I “Export -> Save as Web Page…”, then I can open the html file. And it shows up after knitting with and viewing in my browser.
Another plot
There’s a warning on the ggrough web page that only one plot
will show up on each page.
I’m going to try a second plot here, giving it a title of “Second plot”
so I can see if it shows up.
get_rough_chart(p + ggtitle("Second plot"), options,
                #family = "Homemade Apple",
                font_size_booster = 1.45)
As warned, it just overwrote the first plot above and left a white space here.
Also I couldn’t the font setting didn’t do anything, and in my other tests I couldn’t ever get any font besides the default.
Conclusion
ggrough can make silly looking plots, but still has its issues.
I think it would look better for bar charts where there are spaces between bars.
I would have done more tests and examples, but I can’t get the plots
to show up in RStudio and only one will showup in a RMarkdown document.